Notes about Simulation
Results:
Animation: A display of simulation results over time.
Average: The vertically averaged concentration (cfu/100 ml) of
fecal coliform bacteria simulated in the model.
Domain Exceeded: The domain of the model that exceeded the Exceed
criteria any time during the simulation.
Exceed: Any fecal coliform concentration (cfu/100 ml) greater
than or equal to this criterion is displayed as red
in the Animation or Domain Exceeded.
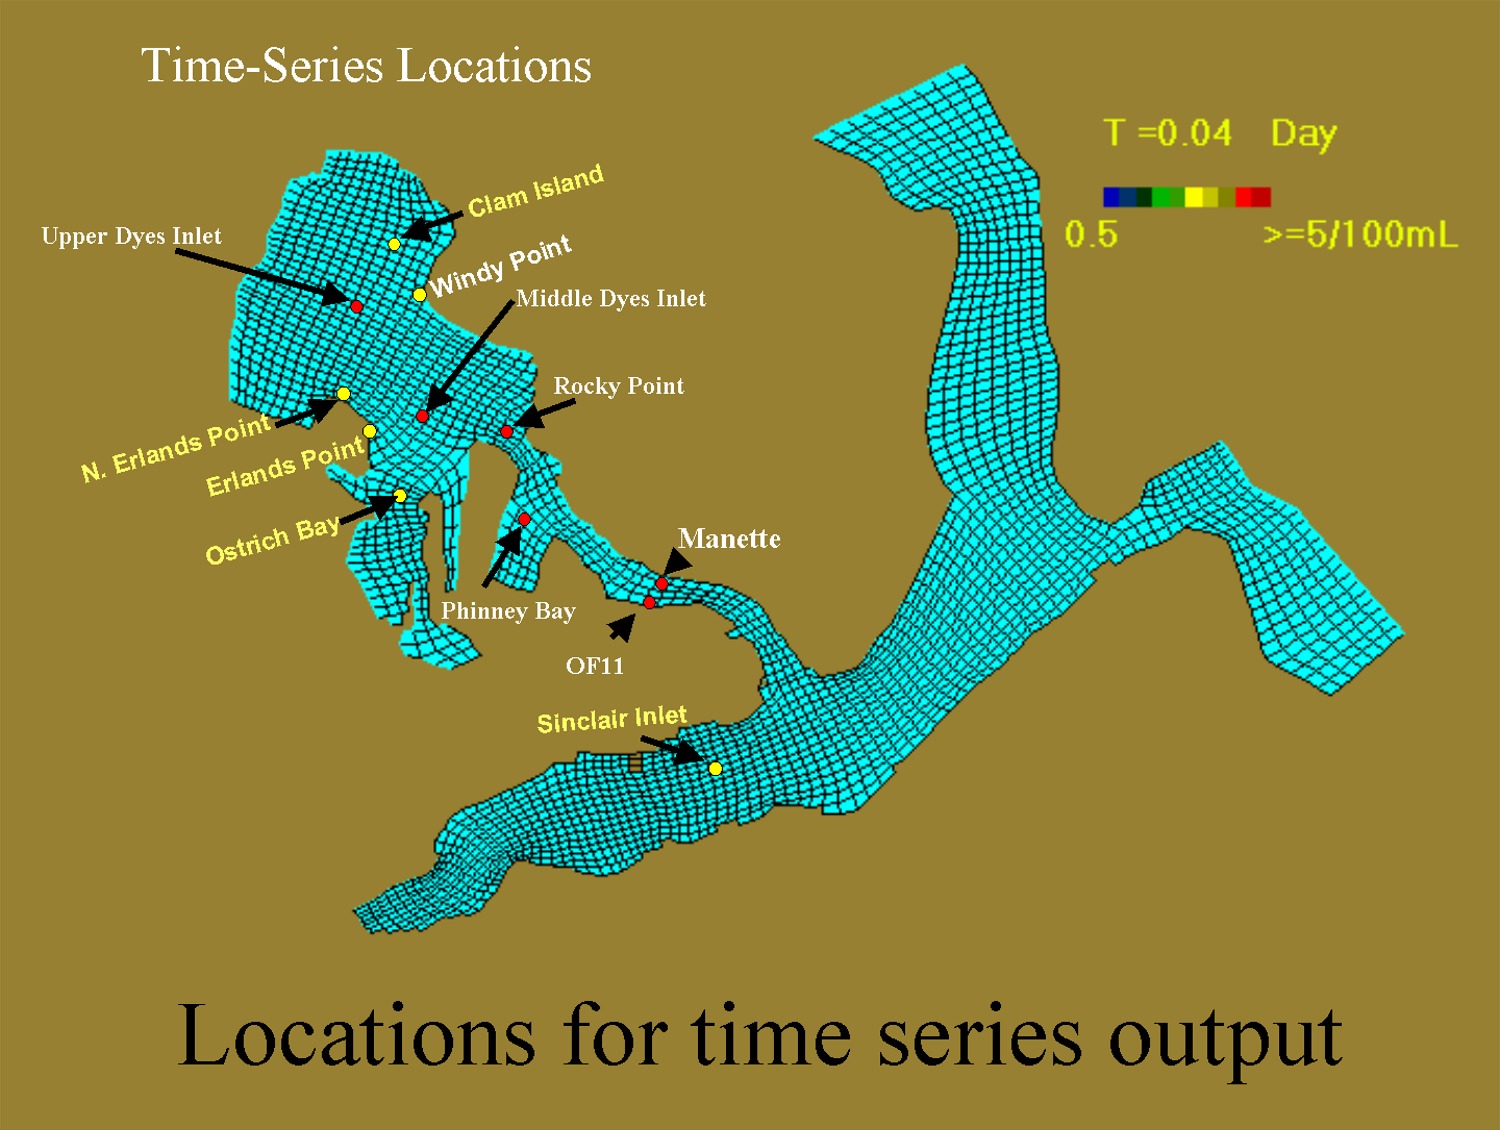
Map: The locations for which Time Series plots
are available (see Map).
Max: The maximum concentration of fecal coliform
bacteria (cfu/100 ml) in the water column simulated by the model.
Overflow: The concentration (cfu/100 ml) of fecal coliform
bacteria assumed to be in the discharge.
Surface: The concentration of fecal coliform bacteria (cfu/100
ml) simulated in the surface layer of the model.
Time Series: A plot of fecal coliform concentration (cfu/100 ml)
over time for selected locations (see Map) during
the course of the simulation.