CSO SIMULATION SCENARIOS
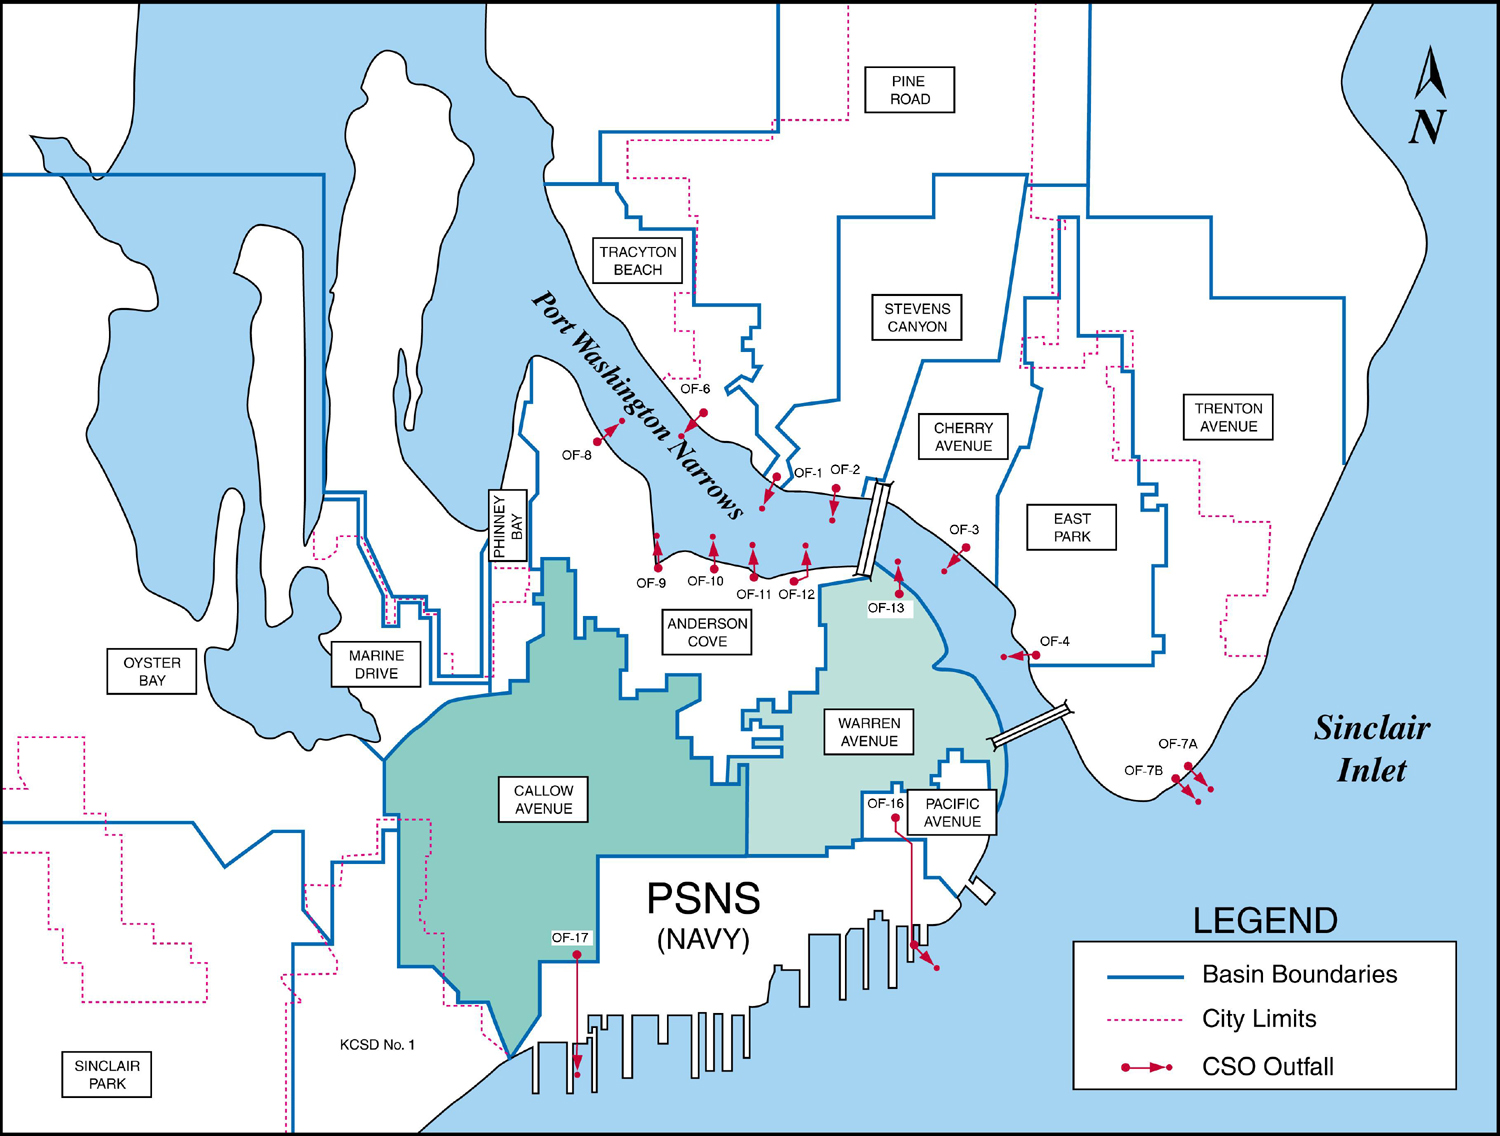
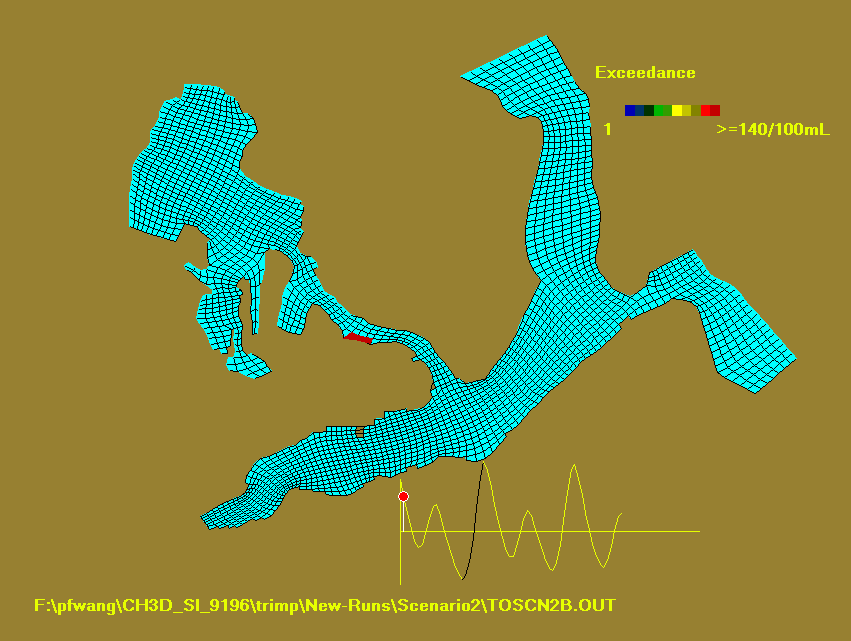
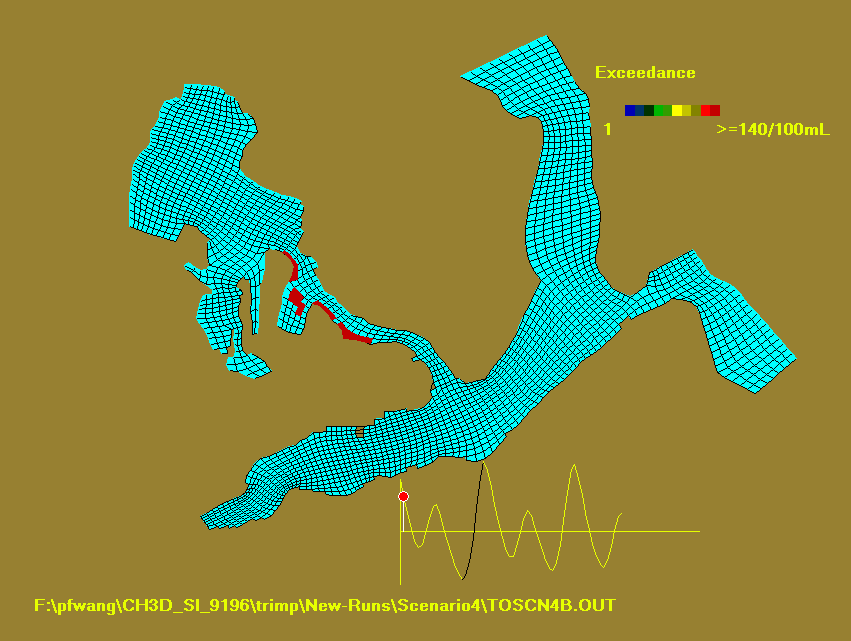
Map of CSO Locations in Port Washington Narrows
Overflow Conditions |
Simulation Results (Notes) |
|||||||||
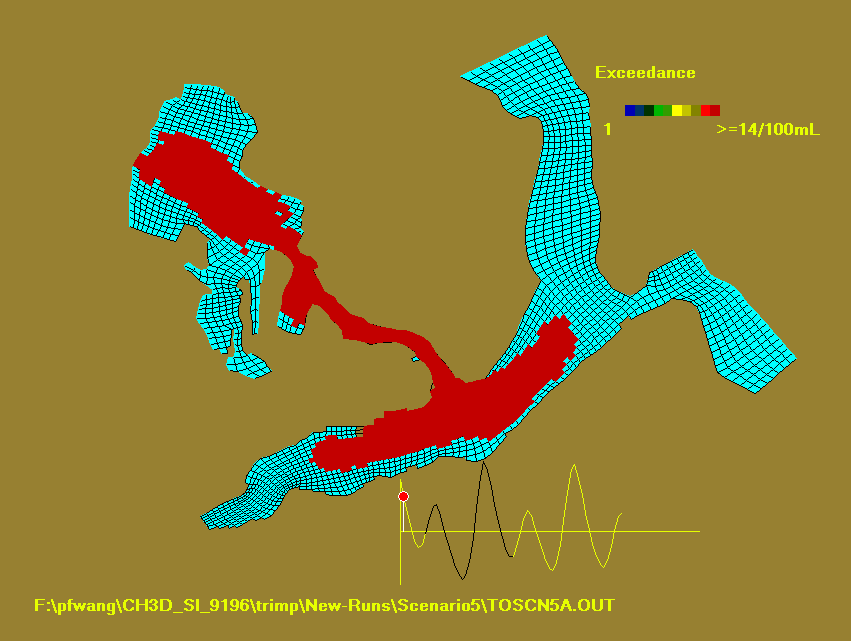
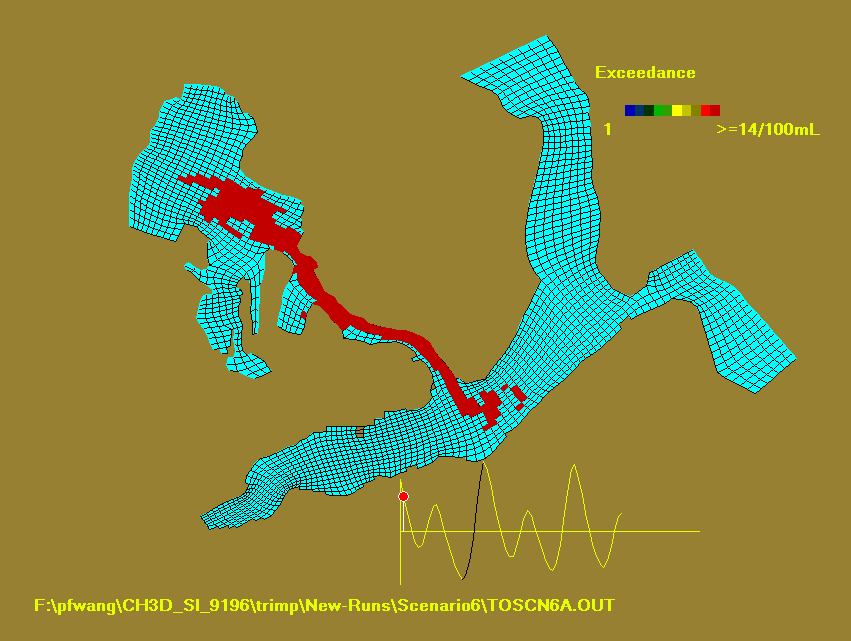
| Overflow = 106 cfu/100 ml Exceed ³ 14 cfu/100 ml |
Overflow=106 cfu/100 ml Exceed ³ 140 cfu/100 ml |
|||||||||
| # |
Event |
Storm |
Outfall |
Volume |
Duration (hr) |
Time |
Animation |
Domain |
Animation |
Domain |
| Combined Sewer Overflow |
||||||||||
| 1 |
Current system 80% complete |
227,000 |
24 |
|||||||
| 2 |
Current system 80% complete |
227,000 |
6 |
|||||||
| Current system 80% complete |
429,900 |
24 |
||||||||
| 4 |
Current system 80% Complete |
429,900 |
6 |
|||||||
| Discharge from Eastside Treatment Facility |
Overflow = 105 cfu/100 ml Exceed ³ 14 cfu/100 ml |
|||||||||
| # |
Event |
Storm |
Outfall |
Volume |
Duration (hr) |
Time |
Animation |
Domain |
|
|
| 5 |
Failure of UV disinfection system |
10,000,000 (7,000gal/min) |
24 |
|||||||
| 6 |
Failure of UV disinfection system |
2,520,000 (7,000gal/min) |
6 |
|||||||
| Future Conditions These simulations assume CSO improvements are completed. |
Overflow = 106 cfu/100 ml Exceed ³ 14 cfu/100 ml |
|||||||||
| # |
Event |
Storm |
Outfall |
Volume |
Duration (hr) |
Time |
Animation |
Domain |
|
|
| 7 |
Future system 100% complete |
No Overflow |
6 |
|||||||
| 8 |
Future system 100% complete |
37,400 |
6 |
|||||||
Sensitivity AnalysisThese simulations are variations of simulation #3. |
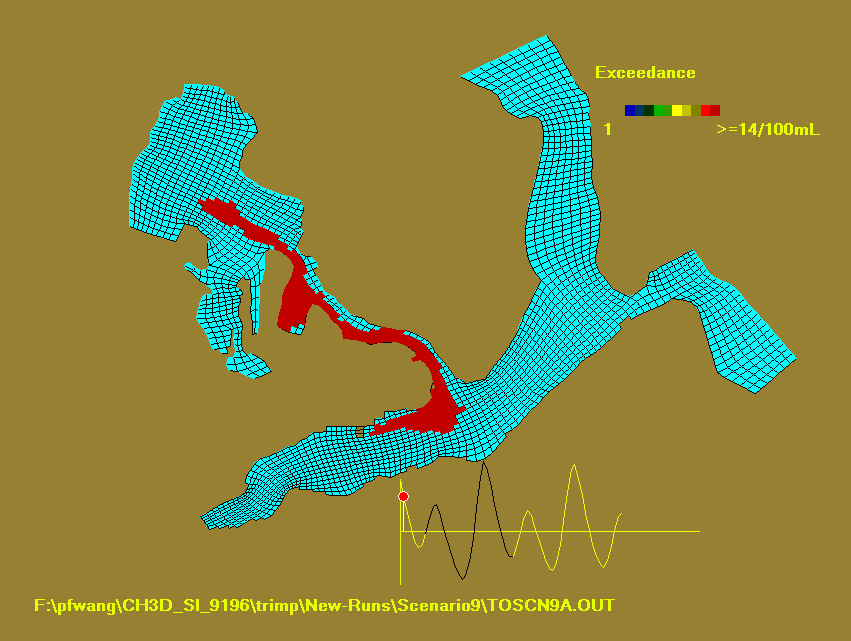
Overflow = 106 cfu/100 ml Exceed ³ 14 cfu/100 ml |
|||||||||
| # |
Event |
Storm |
Outfall |
Volume |
Duration (hr) |
Time |
Animation |
Domain |
|
|
| 9 |
Wind – Constant wind 10 m/s (22.6 mph) from SW |
429,900 |
24 |
|||||||
| 10 |
Turbidity – Decreased secchi depth by 50% |
429,900 |
24 |
|||||||
| 11 |
Sunlight – Decreased sunlight intensity by 50% |
429,900 |
24 |
|||||||
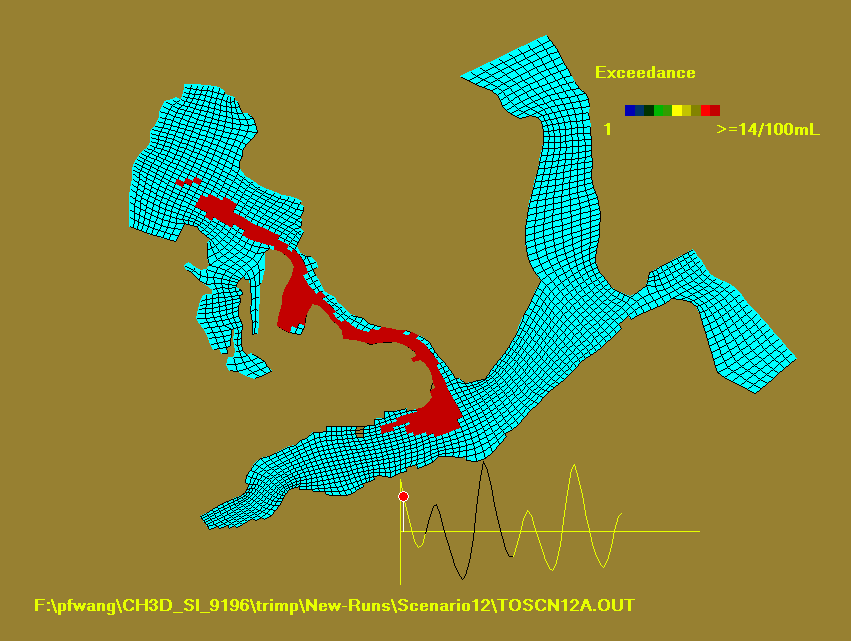
| 12 |
Fresh water inflow – input Jan/Feb mean flow from 10 major streams |
429,900 |
24 |
|||||||
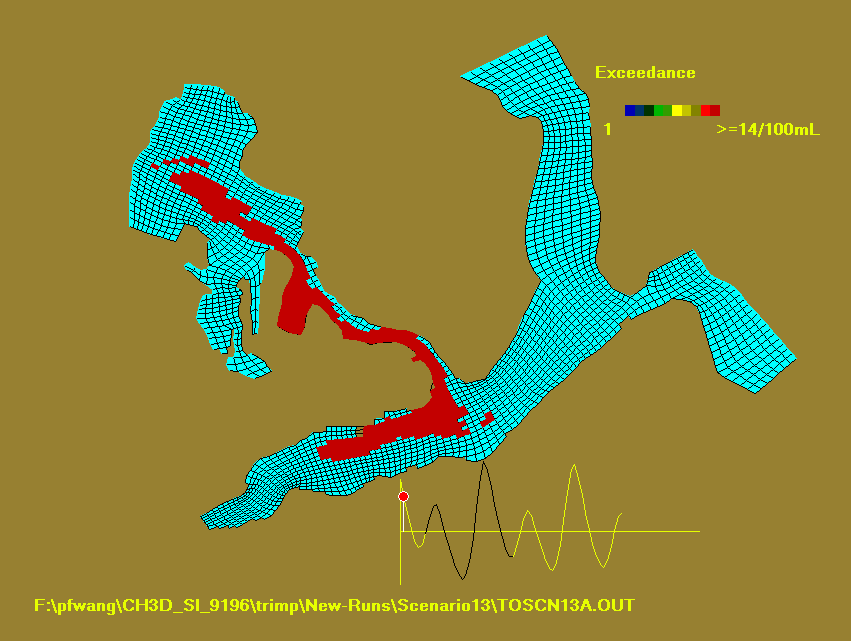
| 13 |
No FC Die Off – simulates conservative substance |
429,900 |
24 |
|||||||
| Simulated Spills |
Overflow = 106 cfu/100 ml Cmax ³ 100 cfu/100 ml |
|||||||||
| # |
Event |
Outfall |
Volume |
Duration (hr) |
Time |
Animation |
|
|||
| 14 |
280,000 |
1 week |
||||||||
· CH3D-FC calibrated and verified for simulating FC transport (Mancini’s Equ) in Sinclair and Dyes Inlets
· Empirical approach used to estimate “typical” CSO volumes
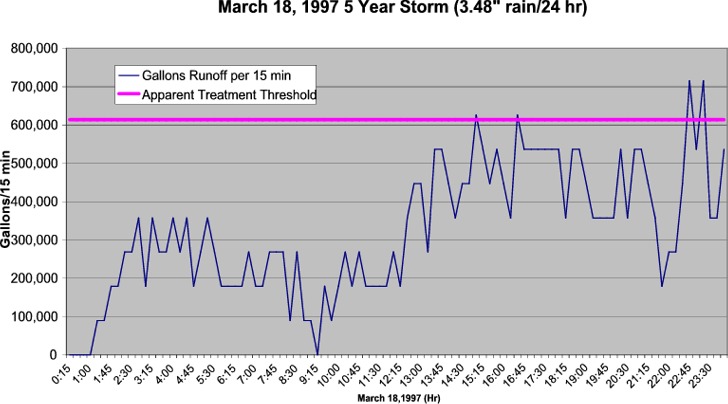
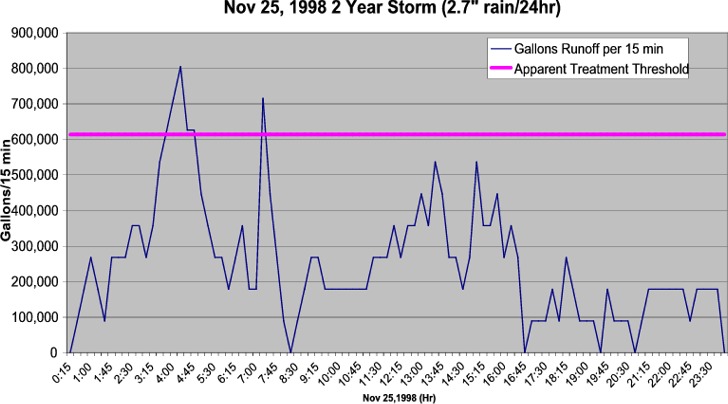
· Nov ’98 and Mar ’97 storms used to simulate overflow conditions
· Fecal coliform persistence controlled by dispersion and decay from sunlight
· FC concentrations predicted by model are based on conservative assumptions
· Simulation of July 2002 spill in Sinclair Inlet agreed with field data (2 samples)
Link to Dye Study Sampling Plan
Link to CSO Modeling Overview Presentation (from ENVVEST Working Group Meeting of July 23, 2003)
Link to Sensitivity Analysis Plots
Simultaneous simulations of sensitivity runs Sensitivity.ppt
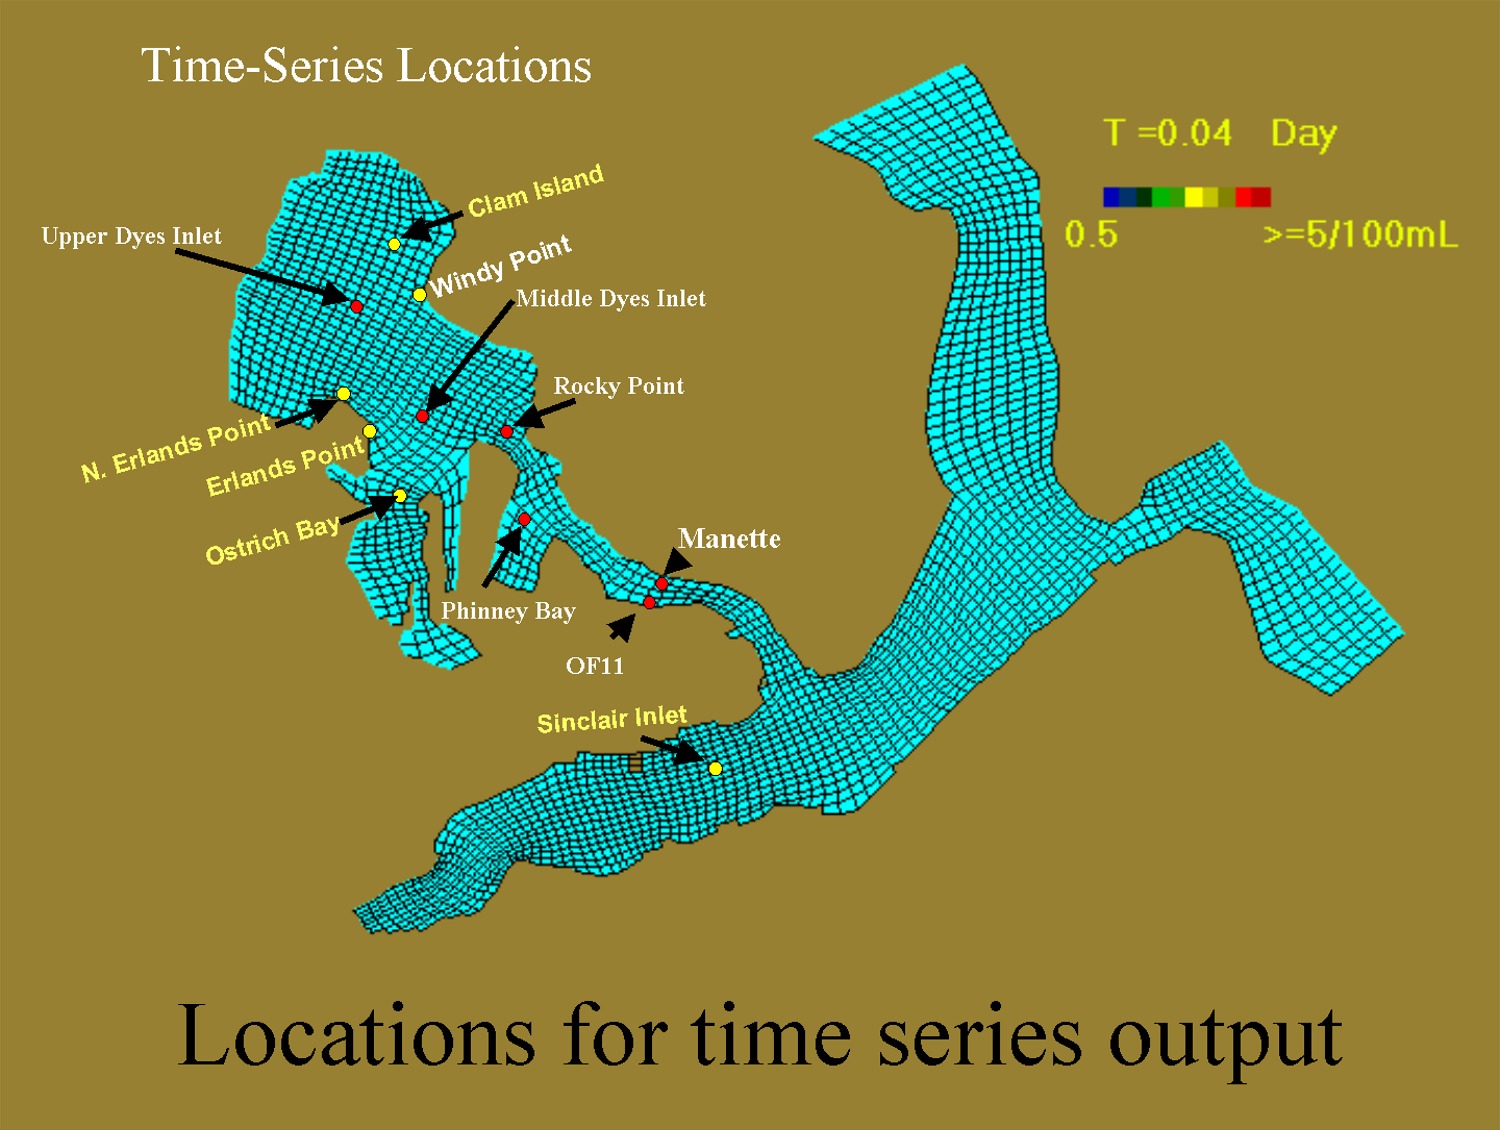
Time series plots:
Sinclair Inlet Station Sensitivity_Sinclair_ts.xls
Phinney Bay Station Sensitivity_Phinney_ts.xls
Middle Dyes Inlet Station Sensitivity_Dyes_ts.xls
Erlands Point Station Sensitivity_ErlandsPt_ts.xls
Windy Point Station Sensitivity_WindyPt_ts.xls
Note from PF Wang on August 29, 2003 pf_note_August_29_03.htm
Reference for Model Simulation Results:
Wang, P.F., R.K. Johnston, H. Halkola, R.E. Richter, and B. Davidson, 2005. A Modeling Study of Combined Sewer Overflows in the Port Washington Narrows and Fecal Coliform Transport in Sinclair and Dyes Inlets, Washington. Prepared by Space and Naval Warfare Systems Center, San Diego for Puget Sound Naval Shipyard & Intermediate Maintenance Facility Project ENVVEST, Final Report of June 18, 2005.