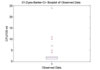
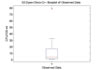
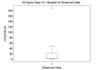
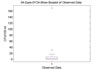
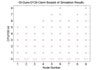
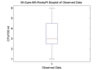
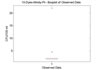
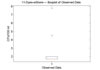
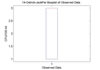
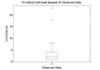
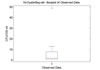
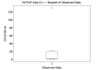
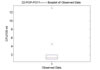
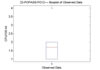
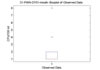
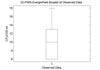
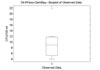
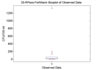
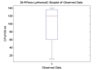
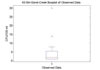
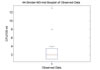
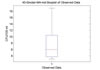
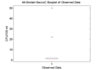
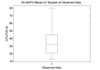
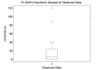
The box plots were generated using the Matlab function 'boxplot'.
"The lower and upper lines of the "box" are
the 25th and 75th percentiles of the sample. The distance
between the top and bottom of the box is the interquartile
range.
The line in the middle of the box is the sample median. If
the median is not centered in the box, that is an indication
of skewness.
The "whiskers" are lines extending above and below
the box. They show the extent of the rest of the sample (unless
there are outliers). Assuming no outliers, the maximum of
the sample is the top of the upper whisker. The minimum of
the sample is the bottom of the lower whisker. By default,
an outlier is a value that is more than 1.5 times the interquartile
range away from the top or bottom of the box.
The plus sign at the top of the plot is an indication of
an outlier in the data." (Matlab 7.14)
Simulated |
Observed |

boxr07_01-Dyes-Barker-Cr-Modeled.jpg |
boxr07_01-Dyes-Barker-Cr-Observed.jpg |

boxr07_02-Dyes-Chico-Cr--Modeled.jpg |
boxr07_02-Dyes-Chico-Cr--Observed.jpg |

boxr07_03-Dyes-Clear-Cr--Modeled.jpg |
boxr07_03-Dyes-Clear-Cr--Observed.jpg |

boxr07_04-Dyes-DY24-StrawModeled.jpg |
boxr07_04-Dyes-DY24-StrawObserved.jpg |
boxr07_05-Dyes-DY28-ClamIModeled.jpg |

boxr07_05-Dyes-DY28-ClamIObserved.jpg |

boxr07_07-Dyes-ErlandsPt-Modeled.jpg |

boxr07_07-Dyes-ErlandsPt-Observed.jpg |

boxr07_08-Dyes-M5-RockyPtModeled.jpg |
boxr07_08-Dyes-M5-RockyPtObserved.jpg |

boxr07_09-Dyes-M7-MidWindModeled.jpg |

boxr07_09-Dyes-M7-MidWindObserved.jpg |

boxr07_10-Dyes-Windy-Pt--Modeled.jpg |
boxr07_10-Dyes-Windy-Pt--Observed.jpg |

boxr07_11-Dyes-wShore----Modeled.jpg |
boxr07_11-Dyes-wShore----Observed.jpg |

boxr07_12-Ostrich-Bay-M6-Modeled.jpg |

boxr07_12-Ostrich-Bay-M6-Observed.jpg |

boxr07_13-Ostrich-eShore-Modeled.jpg |

boxr07_13-Ostrich-eShore-Observed.jpg |

boxr07_14-Ostrich-JackParModeled.jpg |
boxr07_14-Ostrich-JackParObserved.jpg |

boxr07_15-Ostrich-OBCreekModeled.jpg |
boxr07_15-Ostrich-OBCreekObserved.jpg |

boxr07_16-OysterBay-all--Modeled.jpg |
boxr07_16-OysterBay-all--Observed.jpg |

boxr07_17-PhinnyBay-sEnd-Modeled.jpg |

boxr07_17-PhinnyBay-sEnd-Observed.jpg |

boxr07_18-POP-SN17-WatermModeled.jpg |

boxr07_18-POP-SN17-WatermObserved.jpg |

boxr07_19-POP-Dee-Cr-----Modeled.jpg |
boxr07_19-POP-Dee-Cr-----Observed.jpg |

boxr07_20-POP-IllaheeSPCrModeled.jpg |

boxr07_20-POP-IllaheeSPCrObserved.jpg |

boxr07_21-POP-M1-MidChannModeled.jpg |

boxr07_21-POP-M1-MidChannObserved.jpg |

boxr07_22-POP-PO11-------Modeled.jpg |
boxr07_22-POP-PO11-------Observed.jpg |

boxr07_23-POPASS-PO12----Modeled.jpg |
boxr07_23-POPASS-PO12----Observed.jpg |

boxr07_24-POP-SpringBroCrModeled.jpg |

boxr07_24-POP-SpringBroCrObserved.jpg |

boxr07_31-PWN-DY01-mouth-Modeled.jpg |
boxr07_31-PWN-DY01-mouth-Observed.jpg |

boxr07_32-PWN-EvergrnParkModeled.jpg |
boxr07_32-PWN-EvergrnParkObserved.jpg |

boxr07_33-PWN-AnCov-PineRModeled.jpg |

boxr07_33-PWN-AnCov-PineRObserved.jpg |

boxr07_34-RPass-ClamBay--Modeled.jpg |
boxr07_34-RPass-ClamBay--Observed.jpg |

boxr07_35-RPass-FortWard-Modeled.jpg |
boxr07_35-RPass-FortWard-Observed.jpg |

boxr07_36-RPass-LynhwoodCModeled.jpg |
boxr07_36-RPass-LynhwoodCObserved.jpg |

boxr07_37-RPass-M2-midChnModeled.jpg |

boxr07_37-RPass-M2-midChnObserved.jpg |

boxr07_38-RPas-SN18-EntraModeled.jpg |

boxr07_38-RPas-SN18-EntraObserved.jpg |

boxr07_43-Sin-Gorst-CreekModeled.jpg |
boxr07_43-Sin-Gorst-CreekObserved.jpg |

boxr07_44-Sinclair-M3-midModeled.jpg |
boxr07_44-Sinclair-M3-midObserved.jpg |

boxr07_45-Sinclair-M4-midModeled.jpg |
boxr07_45-Sinclair-M4-midObserved.jpg |

boxr07_47-Sin-RossPt-SN08Modeled.jpg |

boxr07_47-Sin-RossPt-SN08Observed.jpg |

boxr07_48-Sinclair-SaccoCModeled.jpg |
boxr07_48-Sinclair-SaccoCObserved.jpg |

boxr07_49-Sin-SN03-PTOW--Modeled.jpg |

boxr07_49-Sin-SN03-PTOW--Observed.jpg |

boxr07_50-SinPO-BlackJ-CrModeled.jpg |
boxr07_50-SinPO-BlackJ-CrObserved.jpg |

boxr07_51-SinPO-KarcherCrModeled.jpg |
boxr07_51-SinPO-KarcherCrObserved.jpg |

boxr07_52-SinPO-SN10-wfroModeled.jpg |

boxr07_52-SinPO-SN10-wfroObserved.jpg |

boxr07_53-Sin-SN11-12mariModeled.jpg |

boxr07_53-Sin-SN11-12mariObserved.jpg |
|