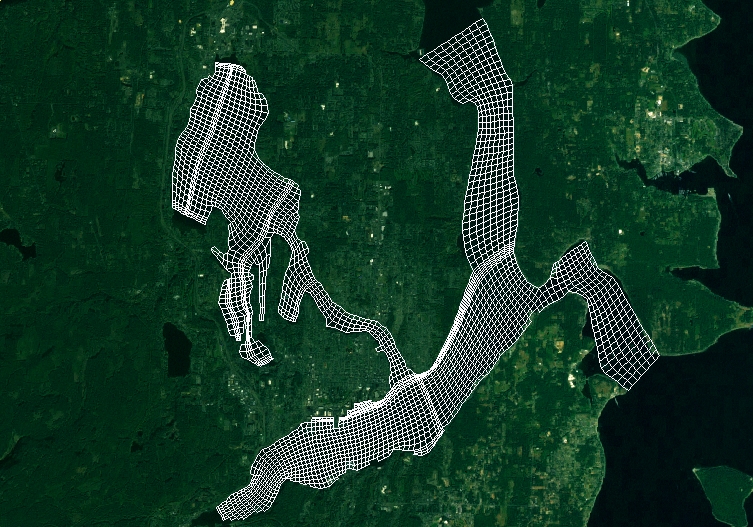
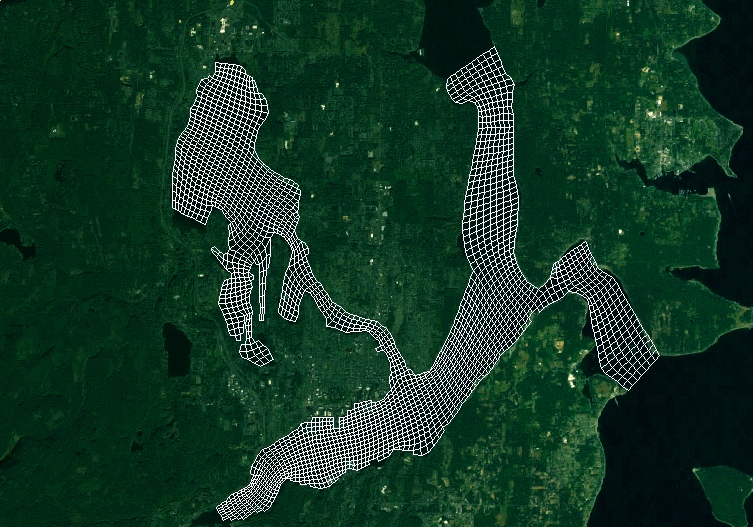
2004 Storms Simulation Results

A series of simulations of storm events sampled in 2004 were conducted to evaluate model performance by comparing to field data. Output from HSPF was using to simulate the runoff for each storm event and the estuarine CH3D-FC model was run to simulate the tides, circulation conditions, and FC inputs occurring during the sampling period starting from 24 hours before the storm event and ending 24 hours after the storm event. CH3D-FC was used to simulate the 25th percentile, geomean, and 75th percentile for the FC loading concentrations. The model output a time series of FC concentrations for each of the loading concentrations simulated. The observed data from each sampling station were compared to the simulated data from the corresponding (or nearest) model grid. The simulated and observed salinity at each station were also compared.

Three specific sampling events were simulated. Output is available from the 94x105 and 91x96 grids:

#

Simulation

Rainfall

FC Concentration

94x105 grid

91x96 grid

S1

April 19-20, 2004

21-Apr-2004

25th Percentile

S1

apr94x105.htm
apr94x105.pdf
S1b, Surf apr91x96.htm apr91x96.pdf SaltSimulation

S2

Geomean

S2

S2b, Surf

S3

75th Percentile

S3

S3b, Surf

S4

May 26-27, 2004

18-May-2004

25th Percentile

S4

may94x105.htm may94x105.pdf S4b, Surf may91x96.htm may91x96.pdf SaltSimulation

S5

Geomean

S5

S5b, Surf

S6

75th Percentile

S6

S6b, Surf

S7

Oct 19-20, 2004

10-Oct-2004

25th Percentile

S7

oct94x105.htm oct94x105.pdf S7b, Surf

oct91x96.htm oct91x96.pdf SaltSimulation

S8

Geomean

S8

S8b, Surf

S9

75th Percentile

S9

S9b, Surf


To view animation, click on simulation #. See also Spatial Data Viewer

The verification results showed good agreement between the modeled and observed data.