S10B: Verification Results for WY2003 CH3D-FC (94x105 grid)
Result_08_94x105 (Simulation Completed on June 21, 2006)
Summary
This page summarizes
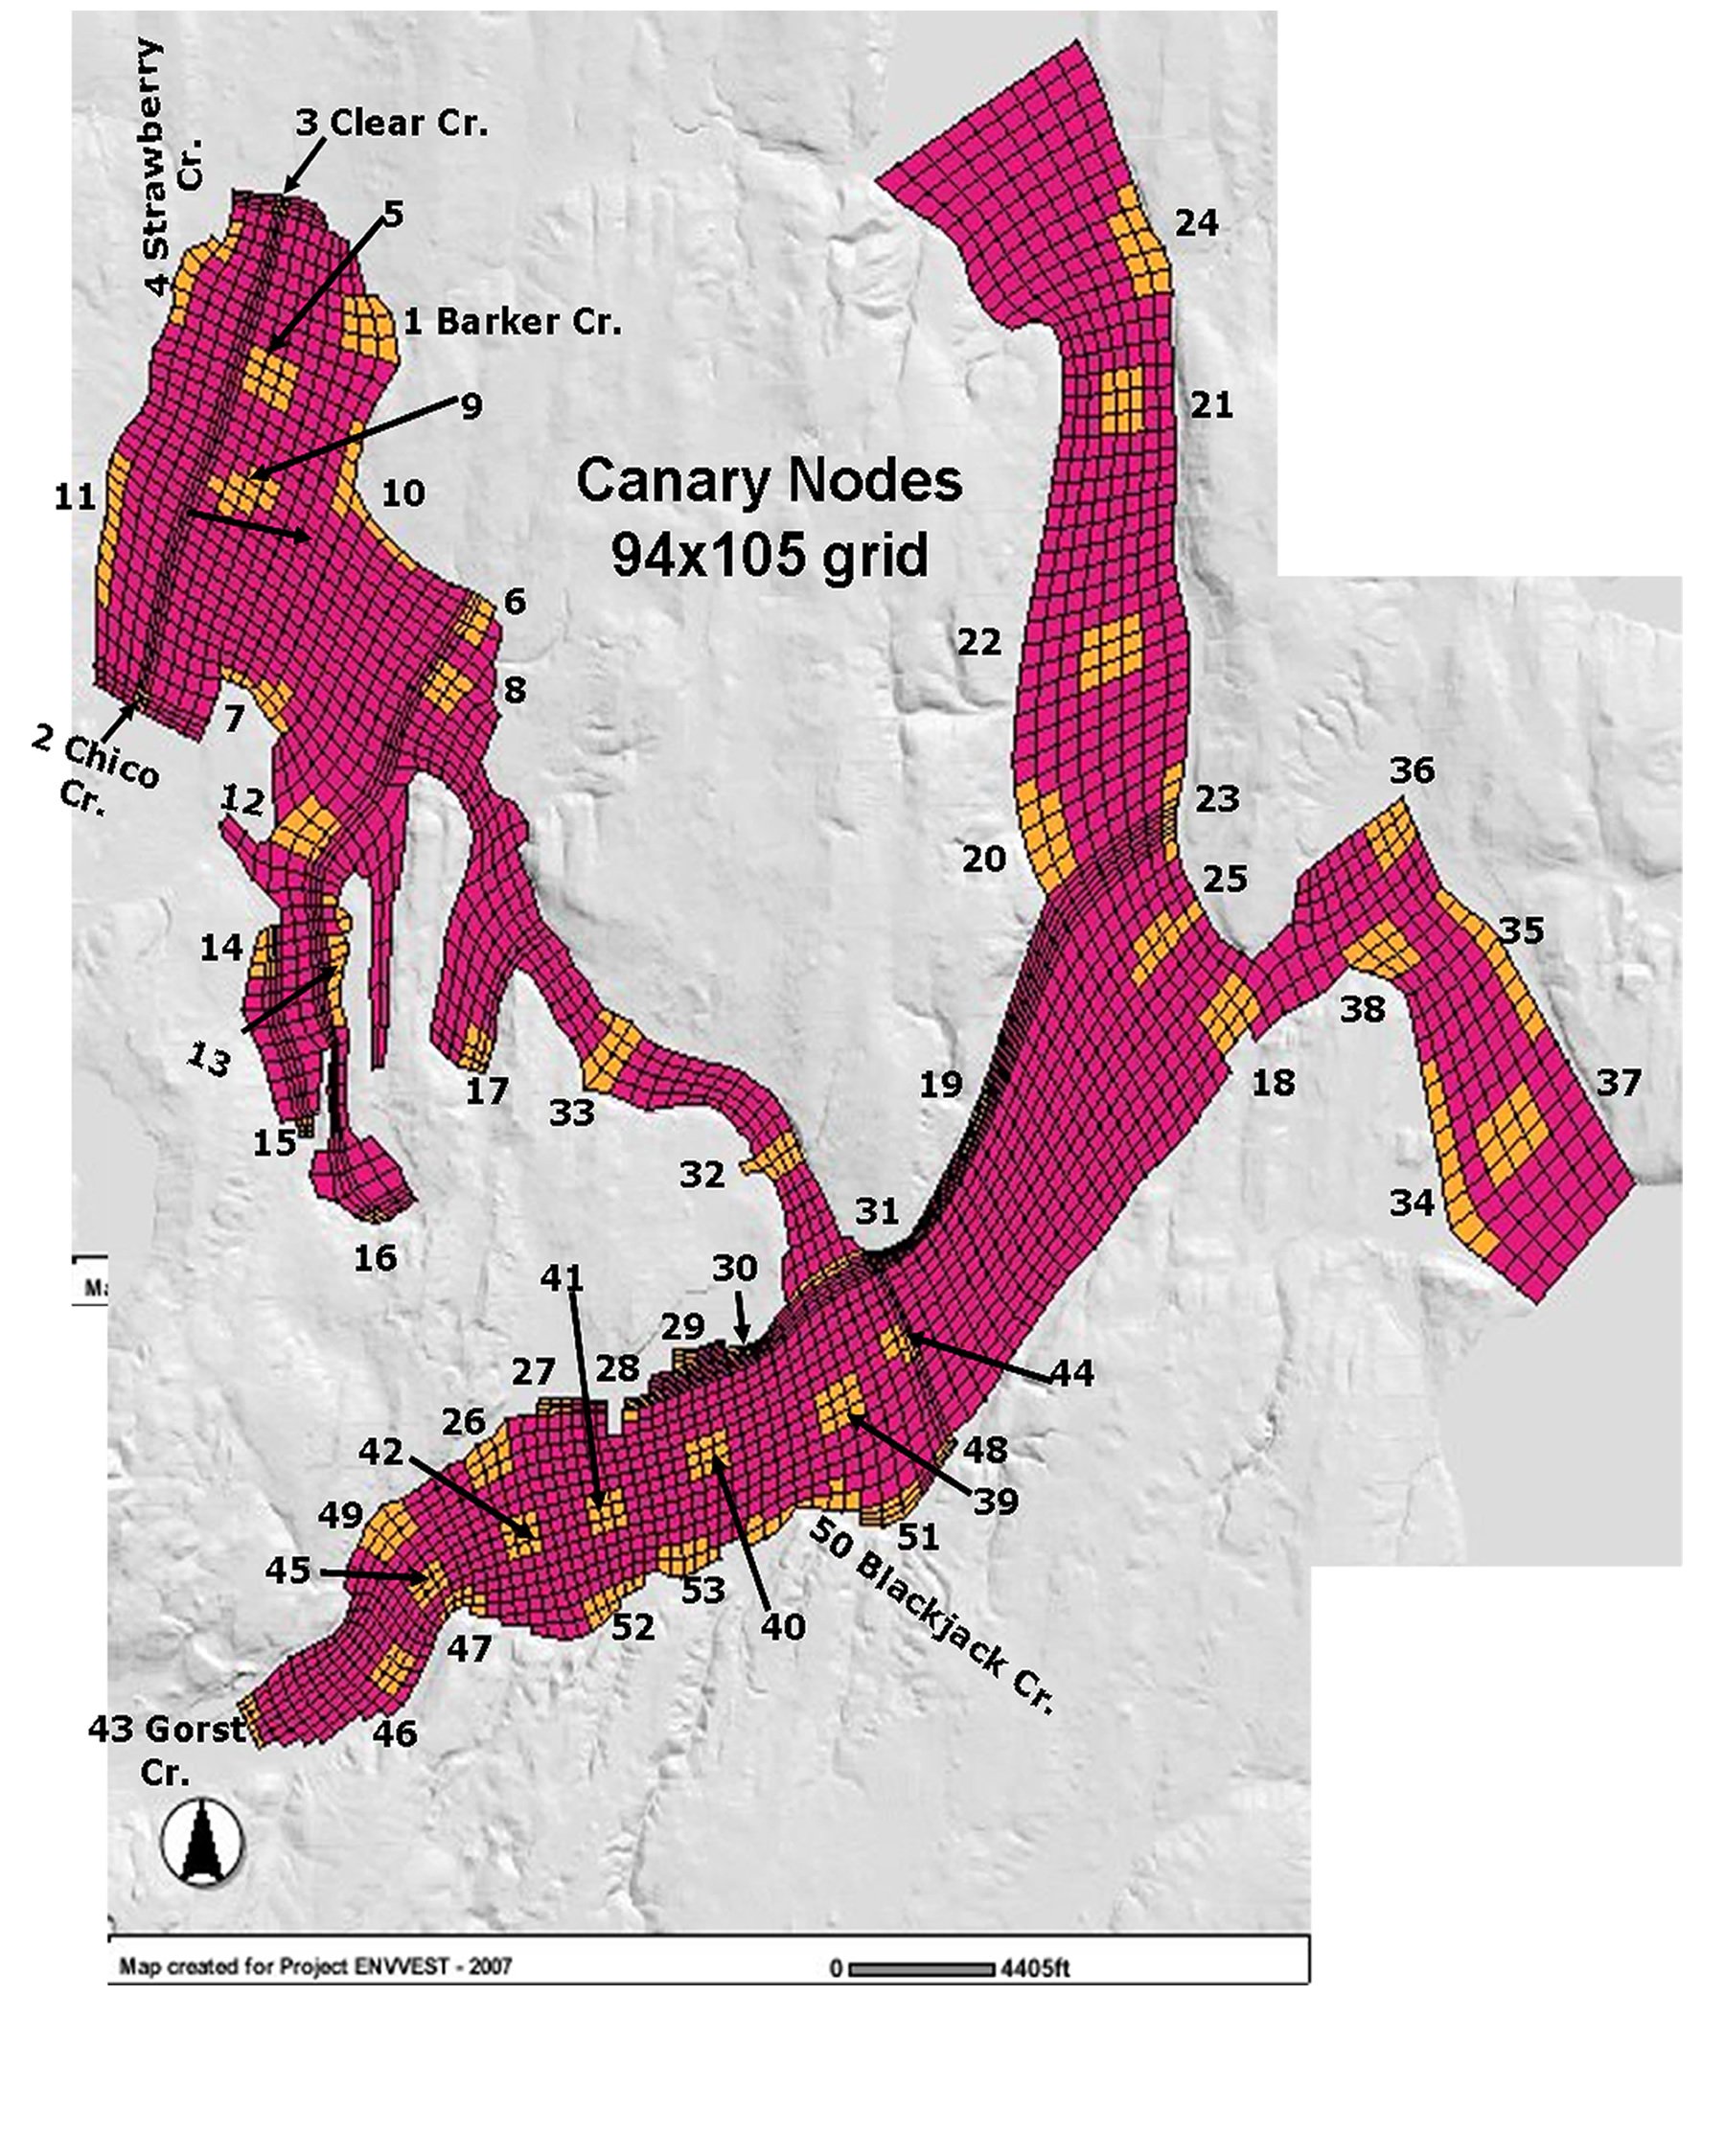
the results of selected nodes (Canary
Nodes 94x105) from the CH3D-FC 94x105 grid. A group
of nine contiguous nodes was selected for each Canary Node (the
colored cells in the Canary
Nodes 94x105 figure). For each group of nine nodes the
time
series of simulated FC concentrations (colored lines) and observed
FC measurements (red circles) are displayed (cfu/100
ml) in the plots listed below. The water quality limits for
the shellfish harvesting
bacteria criteria of 14 cfu/100
ml (geometric mean) and 43 cfu/100
ml (ninety percentile) are also displayed.
Groups
The data plotted are
the time series of simulated canary nodes for the selected group
and the observed data from the station(s) at or closest to the
group. The default
is to plot the concentration of the surface layer for each of
the nine nodes
Spreadsheet of canary
node groups and coordinates: CanaryNodes.xls
Use
the ENVVEST Spatial Viewer to find the id's
of individual nodes (select GENERAL tab -> Highlight Canary
Node: 94x105 Grid to id individual nodes).
Time Series Plots
Plots are provided for each canary node group:
Select plots from the plot
index
Download all plots in zip file: All_plots-10Bjpg.zip
Download all plots as a pdf file: WY2003_ts_94x105.pdf
Time Series
The raw data for the
time series for each group are available as ascii
text.
Download all_grpTS_WY200394x105.zip
Observed Data
The observed data
were marine and nearshore samples collected by ENVVEST
sampling teams, KCHD, and WDOH
during the simulation period Oct 1, 2002 to Sep 30, 2003. The
data were grouped by location and plotted on the time series
plots of simulated data for comparison purposes.
Spreadsheet of observed
FC data: qry_FC_data_94x105.xls
Scatter plots of observed
vs predicted are plotted for all data (ALL) and each canary
node. Plots are provided for both log- and arithmetic-scale:
Access obs-pred
plot index
Download zipfile with all plots 10B_ObsPredplts_jpg.zip
Download pdf file with all plots 10BObsPred_94x105.pdf
Box and Whisker Plots
Box and whisker plots
were generated for the observed and predicted data:
Access box and
whister plot index
Download zipfile with all plots All_boxplts_jpg.zip
Download pdf file with all plots Boxplts_94x105.pdf
Frequency Distributions
Frequency distributions
were calculated for the observed and predicted data:
Access frequency
distribution plot index
Download zipfile with all plots freq_plots.zip
Download pdf file with all plots freq_plots.pdf
Cumulative Distribution Functions (CDF)
CDF
were calculated for the observed data, predicted data using
the 91x96 grid, and predicted data using the 94x105 grid for
selected canary nodes:
Access CDF plot
index
Download zipfile with all CDF plots cdf_plots.zip
Download pdf file with all CDF plots cdf_plots.pdf
|
