S13: TMDL 200/400 for WY2003 CH3D-FC (91x96 grid)
TMDL_200_400 (Simulation Completed on Aug. 17, 2006)
Summary
For this simulation
all streams and stormwater outfalls were set to Part II of the
water quality standard of 200 cfu/100 ml and all WWTPs were set
to 400 cfu/100 ml. The daily max was
used to calculate a 30-day moving geomean
and 90th percentile to compare to the water quality
standard of 43 cfu/100 ml.
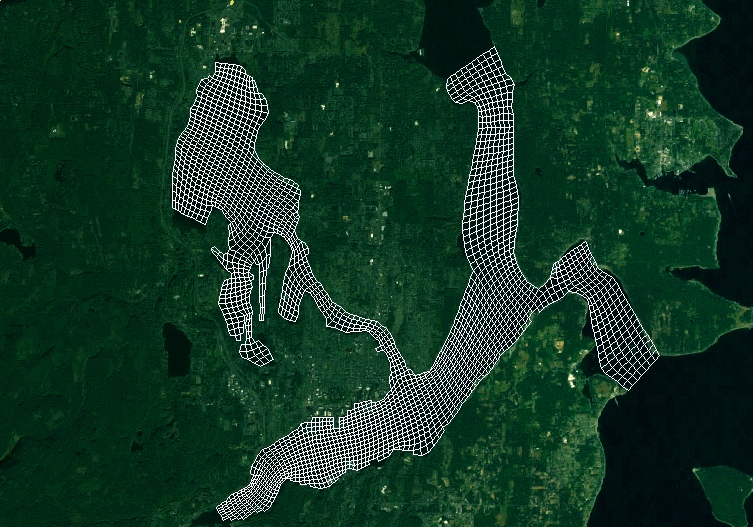
This page summarizes
the results of selected nodes (Canary
Nodes) from the CH3D-FC 91x96 grid. A group of nine contiguous nodes was
selected for each Canary Node (the colored cells in the Canary Nodes figure).
For each group of nine nodes the time series of simulated FC
are expressed as 30-day moving geomean
concentrations (colored lines) and are displayed (cfu/100
ml) in the plots listed below. The water quality limit for Part
II of the shellfish harvesting
bacteria criteria of 43 cfu/100
ml (90th percentile) is also displayed.
Groups
The data plotted are
the time series of simulated canary nodes for each group. Grid
averages consisting of the 30-day rolling geometric mean and
the 90th percentile in the highest 1/2/3/4/6/9 grid
cells were also calculated. The 90th percentile was calculated
as mean + 1.28(stdev) in log space. Plots were generated for
the surface and depth-averaged individual grids and for the
surface and depth-averaged grid averages.
Spreadsheet of canary
node groups and coordinates: CanaryNodes.xls
Use
the ENVVEST Spatial
Data Viewer to find the id’s of individual nodes (select
GENERAL tab -> Highlight Canary Node: “91x96 Grid”
to id individual nodes).
Plots
Plots are provided for each canary node
group:
Calculation Results
The raw data for the
time series for each group as ascii
text and m-files are available: S13_G90time_series_raw.zip
Calculation results
in zipfile: S13_200-400_allCalcs.zip
Explanation of calculation results
200/400 Simulation
results (Streams, Stormwater, and WWTP set to Part II
of the standard) |
|
sheetname |
Explanation |
units |
dailymax |
Simulated maximum daily
FC concentration from Oct 1, 2002 to Sep 29,
2003 (364 days) columns A:I are surface nodes,
Colums J:R are depth-averaged nodes |
cfu/100ml |
m30day |
Moving 30 day Geomean of
daily max FC from Oct 30, 2002 to Sep 29, 2003
(334 days) columns A:I are surface nodes,
Colums J:R are depth-averaged nodes (data were transformed
by log10(FC+1) to calculate geomean) |
cfu/100ml |
EX14 |
Compares moving 30-day Geomean
to 14 cfu/100, cell has 1 if FC>=14 column sum is
number of days for exceedance |
true/false |
EX43 |
Compares moving 30-day Geomean
to 43 cfu/100, cell has 1 if FC>=43 column sum is
number of days for exceedance |
true/false |
EX43_all90 |
Compares moving 30-day 90th-Percentile
to 43 cfu/100, cell has 1 if FC>=43, column sum is
number of days for exceedance. The 90th percentile was
calculated as mean + 1.28(stdev) in log space. |
true/false |
gridAVG_surf |
Surface nodes: The 30-day
rolling geometric mean in the highest 1/2/3/4/6/9 grid
cells, Col A is grid with max levels, Col B is avg of
top 2 grids, Col C is average of top 3 grids, Col D
is average of top 4 grids, Col E is average of Top 6
grids, and Col F is average of all 9 grids |
cfu/100ml |
gridAVG_depthavg |
Depth-averaged nodes: The
30-day rolling geometric mean in the highest 1/2/3/4/6/9
grid cells, Col A is grid with max levels, Col B is
avg of top 2 grids, Col C is average of top 3 grids,
Col D is average of top 4 grids, Col E is average of
Top 6 grids, and Col F is average of all 9 grids |
cfu/100ml |
m30day90 |
The moving 30 day 90%tile
of daily max FC from Oct 30, 2002 to Sep 29, 2003
(334 days). The 90th percentile was calculated as mean
+ 1.28(stdev) in log space. Columns A:I are surface
nodes, Colums J:R are depth-averaged nodes (data were
transformed by log10(FC+1) to calculate geomean and
stdev) |
cfu/100ml |
gridAVG90_surf |
Surface nodes: The 30-day
rolling geometric 90%tile in highest 1/2/3/4/6/9 grid
cells, Col A is grid with max levels, Col B is avg of
top 2 grids, Col C is average of top 3 grids, Col D
is average of top 4 grids, Col E is average of Top 6
grids, and Col F is average of all 9 grids |
cfu/100ml |
fc_target90_surf |
Surface nodes: The fraction
reduction needed as 1 - 43/(90%tile) negative value
means no reduction needed (if geomean=0, -1000 is result);
Col A is result for grid with max levels, Col B result
for average of top 2 grids, Col C is result for average
of top 3 grids, Col D is result for average of top 4
grids, Col E is result for average of Top 6 grids, and
Col F is result for average of all 9 grids |
fraction reduction needed
if positive |
gridAVG90_depthavg |
Depth-averaged nodes: The
30-day rolling geometric 90%tile in highest 1/2/3/4/6/9
grid cells, Col A is grid with max levels, Col B is
avg of top 2 grids, Col C is average of top 3 grids,
Col D is average of top 4 grids, Col E is average of
Top 6 grids, and Col F is average of all 9 grids. |
cfu/100ml |
EX43_90depth |
Depth-averaged nodes: Compares
moving 30-day 90th-Precentile to 43 cfu/100, cell has
1 if FC>=43, column sum is number of days for exceedance |
true/false |
fc_target90_depthavg |
Depth-averaged nodes: The
fraction reduction needed as 1 - 43/(90%tile) negative
value means no reduction needed (if geomean=0, -1000
is result); Col A is result for grid with max levels,
Col B result for average of top 2 grids, Col C is result
for average of top 3 grids, Col D is result for average
of top 4 grids, Col E is result for average of Top 6
grids, and Col F is result for average of all 9 grids. |
fraction reduction needed
if positive |
|
